Beyond Incarceration
Beyond Incarceration:
Investing in rehabilitation for sustainable reintegration and crime reduction.
Amidst escalating expenditures in Canada’s criminal justice system over the past ten years, there has been increasing concern about various programs and services that attempt to combat recidivism. This report delves into a examination of the financial and societal impacts of crime, as well as the costs associated with responses from the criminal justice system. It aims to provide a detailed comparison of these burdens on society.
The core objective of this study is to thoroughly analyze both the financial implications of criminal activities and the expenses related to the operations of the justice system. A significant rise in the costs related to the criminal justice system has raised alarms about the future sustainability of its programs and services in Canada. This increase in spending not only affects government-run programs but also results in substantial direct and indirect costs for victims of crime, including economic losses and emotional trauma. Furthermore, the societal impact is magnified when individuals choose criminal endeavours over contributing positively to the economy.
By evaluating the costs associated with various crimes, this study aims to provide a relative measure of their burdens on society. This includes assessing the financial toll of crimes, the expenses incurred in implementing policies to mitigate crime, and the effectiveness of these strategies. Such information is crucial for informed decision-making in allocating resources effectively in the fight against crime.
THE RESEARCH UNDERTAKEN IN THIS STUDY FOCUSED ON SEVERAL CRITICAL AREAS, WITH PARTICULAR ATTENTION PAID TO TWO KEY AREAS:

Analysis of Crime and Criminal Justice Expenditures
This aspect of the research aimed to provide a detailed breakdown of the costs associated with various types of crime, as well as the expenses involved in criminal justice processes and interventions. The study sought to quantify and compare the financial implications of different crime categories, ranging from minor offenses to major felonies. Additionally, it investigated the costs inherent in the functioning of the criminal justice system, including law enforcement, legal proceedings, correctional services, and rehabilitation programs. This comprehensive analysis aimed to offer a clearer understanding of where and how resources are being allocated within the criminal justice system.

Evaluating the Success of the STDP
A significant focus of the research was on assessing the effectiveness of the STDP in reducing recidivism rates among offenders. The study examined the positive impacts of this program, both in terms of its success in preventing reoffending and the financial benefits accruing to the government as a result. This involved analyzing data on recidivism rates pre and post-participation in the STDP, as well as calculating the cost savings to the government in terms of reduced need for law enforcement, judicial proceedings, and incarceration. The research aimed to determine whether the STDP is an effective tool in rehabilitating offenders and, consequently, in contributing to overall crime reduction and fiscal efficiency for the government.
THE ESTIMATED PER INCIDENT COSTS OF DIFFERENT CATEGORIES OF CRIME.
Estimated Total Cost Per Incident in 2014 $ Canadian


This analysis presents a nuanced understanding of the financial implications of various crimes and criminal justice processes. The methodology for calculating costs varies, with higher estimates typically based on unadjusted means and lower estimates derived from either median values or adjusted averages that exclude statistical outliers. In the specific case of fraud, due to the limited sample size, all three calculation methods resulted in the same cost estimate.
For each type of crime, the lower estimate generally represents a more stable and conservative figure, less influenced by extreme values from any single study. According to the data, homicide stands out as the most expensive crime, with costs ranging between $4.8 and $5.9 million. Following this, sexual assault/rape and aggravated assault are identified as the next most costly crimes using the more conservative estimates. In these cases, the costs borne by victims, both intangible (such as emotional trauma) and tangible (like medical expenses and lost income), were particularly significant.
In stark contrast, theft and residential burglary were found to be the least costly crimes among those reviewed.
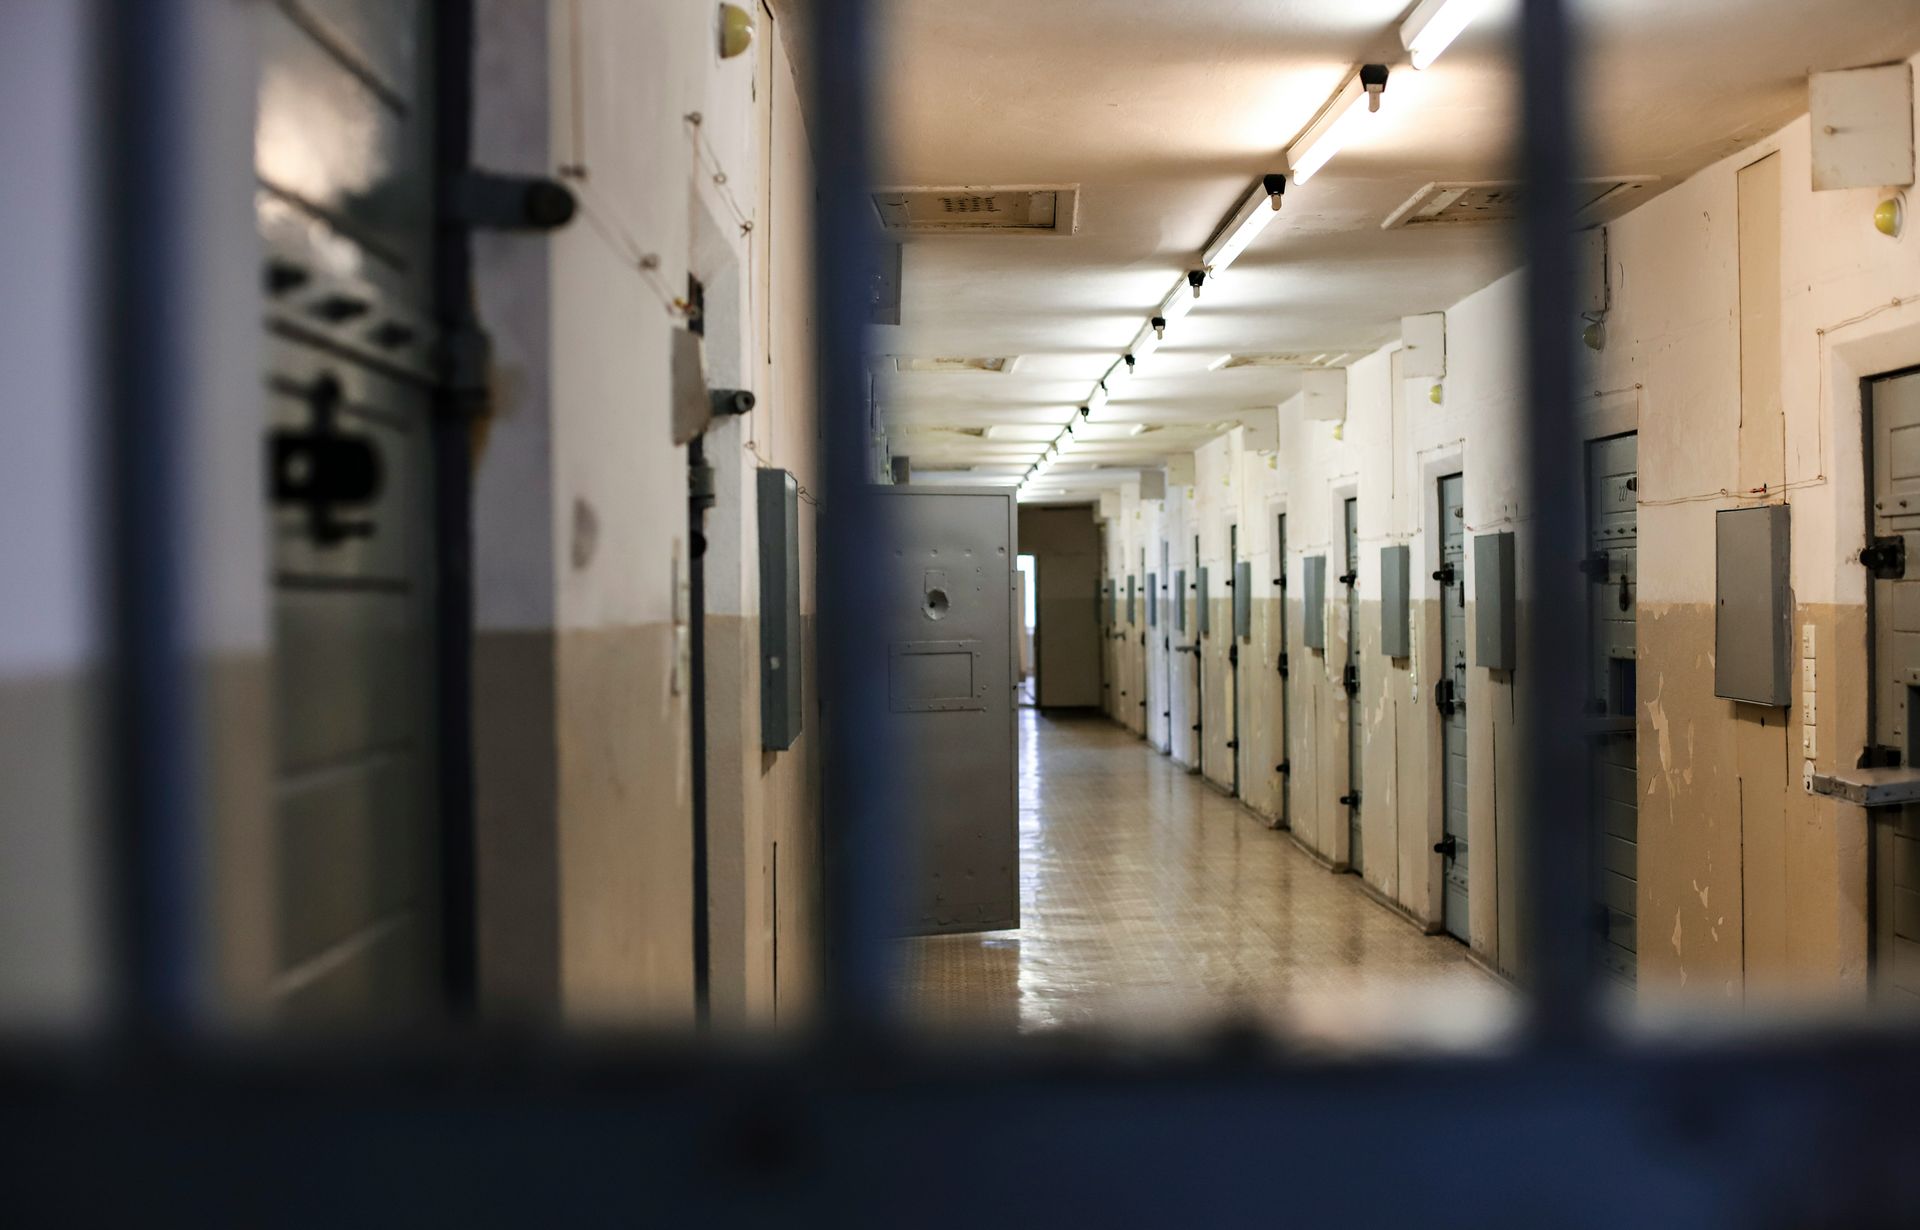
Additionally, the report includes a small subset of studies that provide cost estimates1 per incident, case, or contact for various criminal justice processes. However, due to the limited number of studies available, caution is advised in interpreting these results. The studies indicated that the average annual cost for adult custody (or unspecified inmate custody) is $81,820 per prisoner. Secure youth custody costs are estimated at $51,742 per youth and $65,526 per contact, while open youth custody is significantly cheaper at $3,292 per youth and $926 per contact. Court and trial proceedings show a wide range of costs, from $1,445 to $44,280, varying based on the unit of analysis (per contact, case, or conviction). Policing costs also vary greatly, influenced by the nature of the cost estimation (by case, incident, or arrest). Local custody costs per inmate are around $29,110, while remand admissions cost $18,826 per contact. Less expensive items within the criminal justice system include police warnings/cautions and charging, costing $1,402 and $1,049 per contact, respectively.
It’s important to note that the study which provided cost estimates for contacts with youth defined a ‘contact’ as any interaction ranging from a police caution to a referral to a juvenile justice team or court conference.
1 The one study providing cost estimates for contacts with youth defined contact as one of the following: police caution; referral to a juvenile justice team by police; referral to a juvenile justice team by a children’s court; or court conferences.
Source:
Costs of Crime and Criminal Justice Responses by Thomas Gabor, Ph.D.
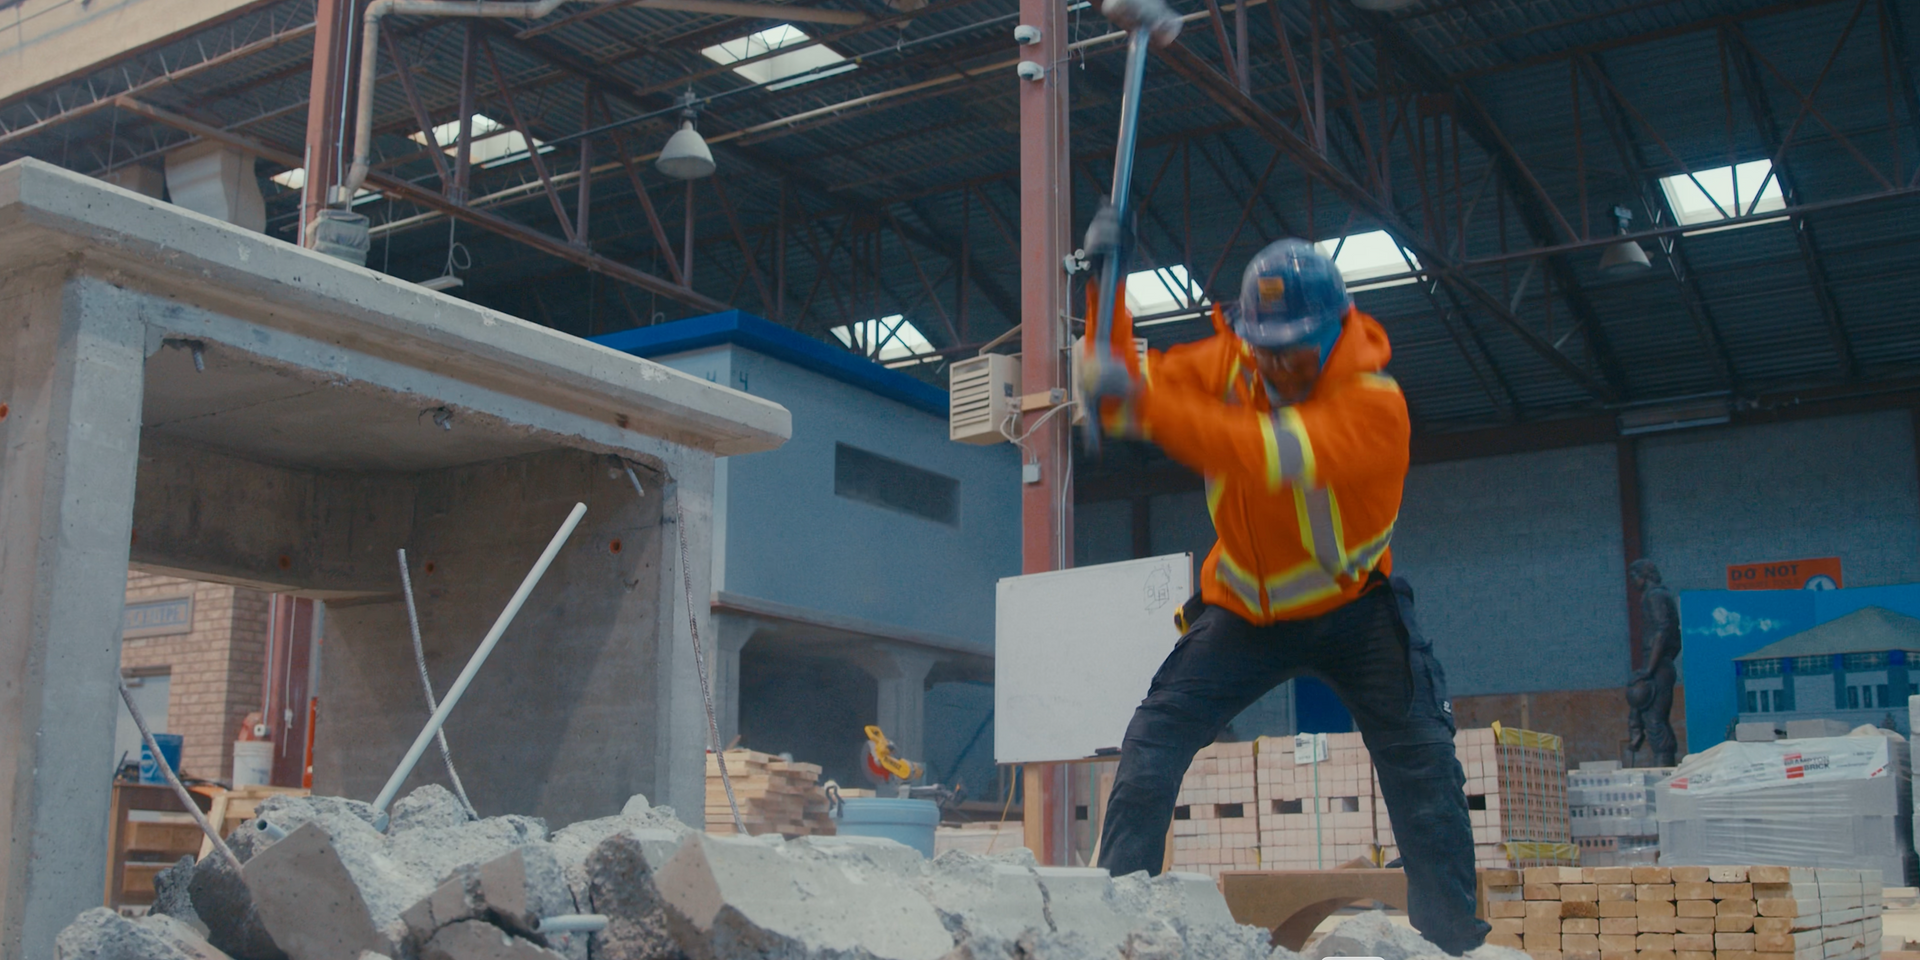
IMPACT OF THE SKILLED TRADES DEVELOPMENT PROGRAM (STDP)
Ultimately, the bottom line question is: Which programs and policy options will yield the greatest reductions in crime at the lowest cost?
Some rehabilitation programs, for example, The STDP has been found to yield reductions
in crime, criminal justice, and mental health costs that are many times the amounts invested.
The STDP has undertaken a comprehensive and multifaceted social development endeavor. The primary objective of this initiative is to empower individuals who have been involved with the justice system or are at risk of becoming entangled in it. These individuals often encounter formidable obstacles when trying to reintegrate into society and secure meaningful and sustainable employment.
LONG TERM BENEFITS OF STDP’S PROGRAM (per client)
Presented below is a detailed 10-year financial forecast outlining projected earnings and tax contributions for program participants. This analysis is based on a conservative annual wage growth rate of 3 percent, reflecting steady career progression within the skilled trades and related sectors. As of January 2025, the starting hourly wages of current participants range between $35.00 and $55.00 per hour, depending on trade, experience, and placement. These figures represent entry-level or early-career earnings and are not indicative of long-term earning potential.
As participants gain experience, certifications, and seniority, their wages are expected to increase annually. Over the 10-year projection period, the average hourly wage is anticipated to surpass $55.00 per hour, reflecting sustained employment, advancement within their respective trades, and improved financial stability. This forecast also incorporates estimated Ontario income tax contributions, providing a realistic view of both personal income growth and the increasing fiscal contribution of participants as they transition into higher-earning roles.
Taken together, this projection offers a comprehensive picture of long-term financial outcomes, demonstrating not only upward income mobility for participants, but also the broader economic and taxpayer benefits generated through stable, well-paid employment over the next decade.


| Year 1 | Year 2 | Year 3 | Year 4 | Year 5 | Year 6 | Year 7 | Year 8 | Year 9 | Year 10 | 10 Years of Work | |
|---|---|---|---|---|---|---|---|---|---|---|---|
| Salary | $ 83,200.00 | $ 85,696.00 | $ 88,266.88 | $ 90,914.89 | $ 93,642.33 | $ 96,451.60 | $ 99,345.15 | $ 102,325.51 | $ 105,395.27 | $ 108,557.13 | $ 953,794.76 |
| Federal Tax | $ 10,198.00 | $ 10,710.00 | $ 11,237.00 | $ 11,780.00 | $ 12,339.00 | $ 12,915.00 | $ 13,508.00 | $ 14,119.00 | $ 14,748.00 | $ 15,397.00 | $ 126,951.00 |
| Provincial Tax | $ 5,229.00 | $ 5,457.00 | $ 5,692.00 | $ 5,935.00 | $ 6,184.00 | $ 6,441.00 | $ 6,755.00 | $ 7,082.00 | $ 7,419.00 | $ 7,808.00 | $ 64,002.00 |
| CPP/EI Premiums Contributions | $ 5,508.00 | $ 5,508.00 | $ 5,508.00 | $ 5,508.00 | $ 5,508.00 | $ 5,508.00 | $ 5,508.00 | $ 5,508.00 | $ 5,508.00 | $ 5,508.00 | $ 55,080.00 |
| Net Pay | $ 62,265.00 | $ 64,021.00 | $ 65,830.00 | $ 67,693.00 | $ 69,611.00 | $ 71,588.00 | $ 73,574.00 | $ 75,617.00 | $ 77,720.00 | $ 79,845.00 | $ 707,764.00 |
| Marginal Tax Rate | 29.65% | 25.29% | 25.42% | 25.54% | 25.66% | 25.78% | 25.94% | 26.10% | 26.26% | 26.45% | |
| Average Tax Rate | 25.16% | 29.65% | 29.65% | 29.65% | 29.65% | 29.65% | 31.48% | 31.48% | 31.48% | 33.89% | |
| Tax Contribution | $ 20,935.00 | $ 21,675.00 | $ 22,437.00 | $ 23,223.00 | $ 24,031.00 | $ 24,864.00 | $ 25,771.00 | $ 26,709.00 | $ 27,675.00 | $ 28,713.00 | $ 246,033.00 |
Note: Salary is calculated based on an hourly rate of $40 per hour, assuming a full-time schedule of 40 hours per week over 52 weeks per year. Annual
earnings are projected with a 3% year-over-year increase and are calculated using 2025 Ontario income tax rates.
TOTAL COMBINED TAX CONTRIBUTIONS
$246,033.00


Share